Astrophotography Lab
OverviewUser Guide
Screenshots
Downloads
Contact
Hosted on GitHub Pages — Theme by orderedlist
User Guide
Table of contents
1. Requirements
Astrophotography Lab is available for Windows and Linux.
The program uses dcraw to convert DSLR raw images. It is included in the Windows versions, but Linux users need to install it by running the following terminal command: sudo apt-get install dcraw
2. Downloading and installation
Additional steps may be necessary depending on the version, so check the readme for the version you are installing.
2.1. For Windows users
Installing a standalone version- Go to the download page and locate the latest Windows standalone version.
- Download "aplab-vx.x.x-win-standalone.zip" from the bottom of the page that is linked to.
- Extract the included folder from the zip file to wherever you prefer.
- The program can now used by running "APLab.exe" from the extracted folder.
- If there is an update for the standalone version on the download page, follow the instructions below for installing it.
- Click the link for the update and download "aplab-vx.x.x-win-update.zip" from the bottom of the page.
- Extract "APLab.exe" and "APLab_debug.exe" from the zip file to the folder where the old version of Astrophotography Lab is located, and overwrite the existing files.
- The update is now installed.
2.2. For Linux users
Installing a standalone version- Go to the download page and locate the latest Linux standalone version.
- Download "aplab-vx.x.x-linux-xx-bit-standalone.tar.gz" from the bottom of the page that is linked to.
- Extract the included folder from "aplab-vx.x.x-linux-xx-bit-standalone.tar.gz" to wherever you prefer.
- Open a terminal window and navigate to the extracted folder. Run the command chmod +x aplab_setup.sh to make the setup script executable, then execute it by writing ./aplab_setup.sh.
- A file named "Astrophotography Lab" will be created, which you can use to start the program from anywhere.
- Click the link for the update and download "aplab-vx.x.x-linux-xx-bit-update.tar.gz" from the bottom of the page.
- Extract the "APLab" file from the tar.gz file to the folder where the old version of Astrophotography Lab is located, and overwrite the existing file.
- The update is now installed.
3. Managing equipment
3.1. The camera menu
The camera selection menu is accessed in the program by clicking "Settings" -> "Camera" -> "Change camera". It will also show when you start the program if no default camera is chosen. If you check the "Use as default" box, the chosen camera will automatically be selected when you start the program in the future.
If your camera is not in the list of available cameras, you can add it by clicking the "Add new camera" button in the camera selection menu. Choose the camera type, input the camera name and pixel size, and click "OK" (if you don't know the pixel size, it shouldn't be hard to find by googling your camera). Your newly added camera can now be chosen from the list, which is sorted alphabetically.
When you have added a new camera, all the tools except for the Image Analyser will initially be inaccessible, since they require sensor data like gain and read noise to function. How to get this data is described in section 7.8. Calculating sensor data. You might also want to add the quantum efficiency of you camera, as described in the middle paragraph in 3.3. Modifying camera or telescope parameters.
3.2. The telescope menu
The telescope selection menu lets you select your telescope or camera lens. Open it by clicking "Settings" -> "Telescope" -> "Change telescope". It works in exactly the same way as the camera selection menu.
If you want to add a new piece of optics, this works much the same as adding a new camera, except that you now have to provide the aperture diameter and focal length.
3.3. Modifying camera or telescope parameters
You can review and modify the sensor data for the currently active camera by selecting "Settings" -> "Camera" -> "Modify camera parameters". You will get a list where you can select any of the camera parameters. If the selected parameter contains multiple values (which will be the case if there is data for multiple ISO or gain values), there is also the option to select which ISO or gain you want to view the parameter value for. You can now change any parameter by inserting a new value and clicking "Set value". The program will be updated with the new parameter value. Note that this will reset the program and clear all the input boxes.
If you have added a new camera, you will notice that there is no value for quantum efficiency (QE). If you want to be able to get the skyglow and target flux quoted as luminances (mag/arcsec^2), you should add a value for the QE via the "Modify camera parameters" menu. What you want to add is the peak QE (for green light if the camera is a colour camera), as a value between 0 and 1, where 1 corresponds to 100%.
The parameters for the selected piece of optics can be modified similarly to the camera parameters, by clicking "Settings" -> "Telescope" -> "Modify telescope parameters".
3.4. Barlow lenses and focal reducers
If you use a barlow lens or focal reducer in your imaging train, you can set the magnification value for this by selecting "Settings" -> "Change FL modifier".
4. Navigation and interaction between tools
4.1. The tool menu
This menu simply lets you navigate between the different tools. You will not lose data that you have added in a tool when changing to a different tool.
4.2. Transferring data between tools
The Image Calculator, Image Simulator and Plotting Tool have buttons for transferring inputted values to other tools. When transferring data from the Image Calculator, you need to at least have calculated a value for skyglow before the data can be transferred, since the Image Simulator and Plotting Tool uses this in their input boxes rather than image data. When transferring inputted values between the Image Simulator and Plotting Tool, all the valid input will be copied directly over to their respective input box in the other tool. Transferring data from raw images in the Image Analyser to the Image Calculator is described this section: 7.7. Transferring data to the Image Calculator.
4.3. Clearing input
All the relevant tools have a button for clearing inputted data. If you click it, you will need to confirm the action before the data is cleared, to avoid that you remove the data by accident.
5. The file menu
5.1. Saving image data
When you have calculated data from your image with the Image Calculator, you can save it so that it's easily accessible later. Click "File" -> "Save image data", and input a name for the saved data set, and click "Save". The data will be stored as comma separated values in a text file called "imagedata.txt".
5.2. Loading image data
You can load a previously saved set of calculated image data by clicking "File" -> "Load image data", and selecting a name from the list. You can load data to the input boxes of either the Image Calculator, Image Simulator or Plotting Tool. The correct values for the input boxes will be chosen depending on the tool you load the data to.
5.3. Managing image data
If you want to delete or rename a previously saved set of calculated image data, click "File" -> "Manage image data". Choose a name from the list, and choose whether you want to delete it or rename it. (The use of the "Add limit signal" button is mentioned in 9.1. Getting suggested imaging settings.) If you clicked "Rename", input a new name in the new window and click "Rename".
6. More settings
6.1. Changing units
If the selected camera profile has a value for QE, you can choose between luminance and electron flux for the skyglow and target signal quantities. The luminance values are quoted in magnitudes per square arcsecond, and depends less on the equipment than the electron flux (e-/s) values. They are therefore better suited for comparing sky and target conditions derived from images captured with different equipment. Note that the "magnitude" unit in question is somewhat dependent on the spectral sensitivity of the camera and will not generally correspond exactly to visual band magnitudes. Change the unit via the "Settings" -> "Signal quantity" menu.
You can also choose between stops and decibels for dynamic range by clicking "Settings" -> "Dynamic range unit". Finally you can get angular distances like field of view quoted in either degrees, arcminutes and arcseconds, or degrees only, by clicking "Settings" -> "Angle unit".
6.2. Tooltips
The tooltips that are displayed when you hover over a value or input widget in some of the tools can contain some useful information, but if you want you can disable them by clicking "Settings" -> "Tooltips" -> "Toggle tooltips". Here you can also choose whether you want them to disabled or enabled as default when you start the program.
6.3. Changing font size
The default font size is determined automatically based on your screen resolution. But you can select a font size manually by clicking "Settings" -> "Change font size" and choosing a size from the list. The new default font size will now be the one you selected. Note that changing the font size will restart the application, and all information in the input boxes will be lost.
6.4. Reverting to original default values
When you check the "Set as default" box in the camera or telescope menu, your choice will be stored in the bottom of "cameradata.txt" or "telescopedata.txt" respectively. If you want the camera or telescope selection menu to show up every time you start the program, open the respective text file, scroll to the very bottom of the file and change the name after "Camera: " or "Telescope: " to "none". If you want the font size to be adjusted automatically based on screen resolution, change the number after "Fontsize: " to "auto" in "cameradata.txt".
7. The Image Analyser
The Image Analyser tool allows you to load raw images and extract information from them. The images that you add must be placed into one of five different categories: light, dark, bias, flat or saturated. The light frame is the actual image of your target. The bias, flat and saturated frames are used for calculating sensor data (see 7.8. Calculating sensor data), while the dark frames are for providing data for the Image Calculator (see 7.7. Transferring data to the Image Calculator).
7.1. Adding images
You can only add a limited number of images, specifically 1 light, 2 dark, 2 bias, 2 flat and 1 saturated, since this is all that is needed for the various calculations. Usually you would just add 2 bias, 2 flat and 1 saturated when you want to calculate sensor data, 1 light and 2 dark when you want to extract data for the Image Calculator, or 1 light when you just want to find the field of view or measure an angular distance.
If you use a CCD, make sure to specify whether it's monochrome or colour before you start adding images. When you add an image, the program will check the image metadata for information about the ISO (for DSLRs) and exposure time. These will be compared to the corresponding values for any already added images, and you will be notified if the values differ between the images if they shouldn't. For colour cameras, you might also be which colour of pixels you want to extract. Splitting the colour filter array (CFA) into its component colours is necessary to ensure valid measurements of shot noise. If the CFA pattern of your camera is not detected, you will be asked to specify this as well.
7.2. Selecting and removing images
You can select added images by left-clicking on their names in the "Files" list. The name of the selected image will get a blue background, and the image will be displayed to the right. Right-clicking on an image name will mark it for removal, and the background will get red (or green if the image is also selected). Right-clicking again on a red name will remove all the marked images.
7.3. Adjusting image view
By default, the added images are displayed in 1:1, so that one image pixel corresponds to one pixel on the computer screen. If you right-click in an image and select "Fit to window", the image will be resized so that the entire image is visible. Right-click and select "Show full image" (yes, this is confusing and will be changed in the next update) to revert the resizing. Note that some functions, like extracting image data, are not available while the image is fitted to the window.
7.4. Pointer modes
By default, when you click and drag in an image, a selection box will appear. This is used for selecting regions for extracting data to the Image Calculator, or when you want to look at the statistics of a limited part of the image (see 7.6. Getting image statistics). If the active frame is a light frame, the field of view of the selected region will be shown rather than of the entire frame. You can activate the selection mode by right-clicking in the image and choosing ""Select" mode".
There is also a measuring mode, which is only available for light frames. This makes it possible to drag a line between to points, and the angular distance between the two points will be displayed. Right-click in the image and choose ""Measure" mode" to activate it.
Finally there is the dragging mode, which allows you to click and drag in the image to move around instead of using the scrollbars. Activate it by right-clicking in the image and choosing ""Drag" mode".
7.5. Histogram and screen stretch
Right-clicking in an image and choosing "Histogram" will bring up the histogram of the image with options for adjusting the screen stretch. When an image is loaded, the program applies a stretch that corresponds to clipping the black and white point and bringing the mean pixel value to 25% gray. You can adjust this stretch with the histogram tool. Moving the slider to the left and clicking "Stretch histogram" will increase the contrast of the image, while moving the slider to the right will decrease the contrast. The "Clip black point" button sets the lowest pixel value in the image to black, and the "Clip white point" button sets the highest pixel value to white. Clicking "Autostretch" will apply the same stretch as when the image is loaded. Finally you can set the histogram to it's unstretched state, so that the image will be displayed in the raw, linear state. Note that you must click "Apply changes" to apply the histogram changes to the displayed image.
7.6. Getting image statistics
You can bring up a window showing various statistics about the pixel values in the image by right-clicking and selecting "Show statistics". If you have selected a region in the image, the statistics will be computed for that region only. Otherwise they will be computed for the entire image.
7.7. Transferring data to the Image Calculator
The Image Analyser tool allows you to extract from your light and dark frames all the information required by the Image Calculator. Here is how to do it:
Background and target data:
- Add the light frame you want to use in the Image Analyser.
- Left-click and drag to draw a selection box over a background part of the image. The mouse pointer needs to be in the "Select" mode. (Change mode by right-clicking in the image and choosing the mode in the menu.)
- Make the box as large as you can without including any stars. If there are very many stars, make sure it contains as few as possible without being too small.
- Right-click anywhere in the image and select "Transfer data to Image Calculator". When asked which image region you have selected, choose "Background". The data from the selected region has now been copied to the input boxes of the Image Calculator.
- Next, you need to draw a new selection box over a small region of the target. This will be the part of the target that the calculated SNR and target signal value will apply to.
- Right-click in the image again and select "Transfer data to Image Calculator". This time choose "Target" in the window that pops up. The target level has now been copied to the corresponding input box in the Image Calculator.
Dark frame data:
You have the option to use either one or two dark frames. If you use two, one of them can be subtracted from the other to remove static features like hot pixels. This will be done automatically for DSLR cameras to get better noise measurements.
- If you use a DSLR and only one dark frame, you should draw a selection box over a part of the image containing few hot pixels. Otherwise you shouldn't draw a selection box.
- Right-click anywhere in the image and select "Transfer data to Image Calculator". The data from the dark frame has now been copied to the corresponding input boxes in the Image Calculator.
7.8. Calculating sensor data
If you use a DSLR, decide which ISO value you want the data calculated for. Use this ISO for all test images. Make sure the camera is set to save the images in RAW format.
If you use a CCD, keep settings like binning and read rate the same for all test images.
Take the following test images with your camera:
Two bias frames: The sensor should be covered and the exposure time should be as short as possible.
Two flat frames: Image an evenly illuminated white surface. The histogram peak should be about half the way to the right, and the exposure time shouldn't exceed a few seconds unless the camera is cooled.
One saturated frame: Image something bright, and make sure some part of the image contains completely saturated pixels. Ordinary light frames will usually have saturated pixels. The saturated frame is only used to determine the white level.
Start APLab and add the frames you just captured in the Image Analyser tool.
Click the "Compute sensor data" button. If there is no frame in the saturated category, but there is a frame in the light category, you'll be asked if you want to use the light frame as a saturated frame. The calculated values will be displayed, and you can now save this information to use with the other tools.
8. The Image Calculator
The Image Calculator uses data from a light frame (and optionally 1 or 2 dark frames), to compute a range of values related to signal and noise. Information about the active camera and optics is displayed as well. Details about the quantities expected by the various input boxes is provided in their respective tooltips. It is recommended that you acquire the noise and level values for the input boxes with the Image Analyser, as described is the tutorial linked to above. Note that input to the "Target level" box is not required to perform calculations. Omitting it will exclude target signal and SNR from the calculations.
9. The Image Simulator
The Image Simulator works similarly to the Image Calculator, but uses explicit dark current, skyglow and target signal values rather than pixel values. This tool is not intended for finding information about your actual image, but rather for experimenting with different values for the imaging parameters. You could for instance load calculated data from the Image Calculator, and then see what would happen if you had used a different ISO setting or exposure time, or if you stacked multiple frames.
To help with visualizing the results, a synthetic image can be generated based on the imaging parameters and sensor data. This image will have similar signal and noise characteristics as a real image captured with the same parameters and conditions. Click the "Simulate image" button, and the synthetic image will show up in a new window. The image is linear by default (and thus corresponds to what the raw image would look like), but you can show a stretched version of the image by checking the "Stretch:" box.
9.1. Getting suggested imaging settings
A major purpose of APLab is to let you find the best camera settings for your imaging projects. But with all the information available from the tools of APLab, isolating the relevant info and interpreting it can be a challenge. This is where the "Get suggested imaging settings" function comes in.
Using signal values from the Image Simulator input boxes, it will find values for exposure time and ISO (for DSLRs) that are expected to nearly maximize stack SNR, while avoiding unwanted saturation. Since how much saturation is "unwanted" will depend both on the target and personal preferences, you will be in control of this through the parameter called (for the lack of a better name) "limit signal". This is the brightness of some part of your target that you don't want to over-saturate when imaging.
In order to find sensible values for the different parameters, it is recommended that you use an existing raw image of the target. The following steps describe how to get the suggested imaging settings for your target, assuming that you already have a raw image of the target.
1. Follow the instructions in 7.7. Transferring data to the Image Calculator to extract target and background data from your image of the target (getting dark frame data is recommended).
2. Go to the Image Calculator, click "Calculate data", and then "Transfer data to Image Simulator", leaving the "Transfer limit signal only" box unchecked. You might want to save the image data as described in 5.1. Saving image data.
3. If you don't think over-saturation will be an issue when imaging this target, skip to step 5, and leave the "Limit signal" input box in the Image Simulator empty. Otherwise, go back to the Image Analyser, look at the image and find the brightest part the target that you do not wish to become over-saturated. This could for instance be the core of a galaxy or a bright part of a nebula. Draw a small selection box around this part, including nothing else. Right-click anywhere in the image and select "Transfer data to Image Calculator", then "Target" and "OK".
4. Go to the Image Calculator again, and click "Calculate data". The new value that has been calculated for target signal is what we want to use as limit signal. Check the "Transfer limit signal only" box, and click "Transfer data to Image Simulator". The limit signal value will be copied to the corresponding input box in the Image Simulator. If you saved the image data in step 2, you can add the limit signal value to the save by selecting "File" -> "Manage image data", selecting the save and clicking "Add limit signal".
5. Go to the Image Simulator, and hit the "Get suggested imaging settings" button. Only the dark current, skyglow and target signal values are used for the calculations, in addition to the limit signal value if it's provided (if it isn't provided, the target signal is used instead). In the window that pops up, input the total imaging time for the planned session and the maximum sub exposure time that your equipment allows, then click "Done". A window will appear with the results.
Before you hurry out to get that perfect image of M51, remember that the suggested values can be affected by inaccuracies in the underlying data, and thus shouldn't be trusted blindly. Use them rather as guidelines if they seem reasonable, and keep in mind that there is no substitute for experience. It can be useful to know the basis for the suggested values, so I recommend that you check out 9.2. How suggested imaging settings are calculated below.
9.2. How suggested imaging settings are calculated
1. The longest allowed sub exposure time is determined. This is the exposure time required to bring the brightness level of the parts of the image corresponding to the limit signal to 90% of the saturation limit. If this time is longer than the max exposure time provided by the user, the max exposure time is used instead.
For DSLRs, step 1 will be performed for each ISO value, and the exposure time will generally be different for each ISO since the saturation capacity varies. The following step is only performed for DSLRs:
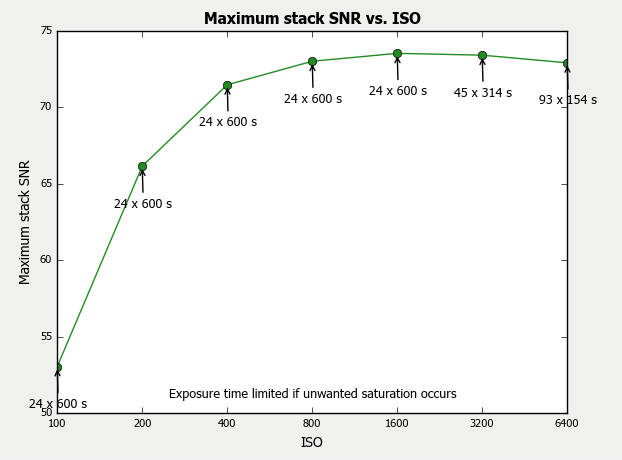
1.5. For each ISO, the number of subframes required to get the total imaging time with the exposure times found above is calculated. The program then calculates the signal-to-noise ratios of the resulting stacked images. All this is exactly what is done when generating the "Max stack SNR vs. ISO" plot, of which an example is shown below. The ISO value that gets the highest stack SNR is then chosen as the optimal ISO. We now have the ISO and exposure time that would yield the highest SNR while still avoiding unwanted saturation.
Next, the following steps are performed regardless of camera type:
2. The longest allowed sub exposure time determined above will be short enough to avoid unwanted saturation, but often it will still be unnecessarily long. Look at the "Stack SNR vs. sub exposure time" plot below. It flattens rapidly for increasing exposure times, and often the exposure time can be reduced significantly, with only a minimal reduction of SNR. A shorter exposure time will generally mean that a lower fraction of the subs need to be discarded, and this will yield a higher SNR in the end.
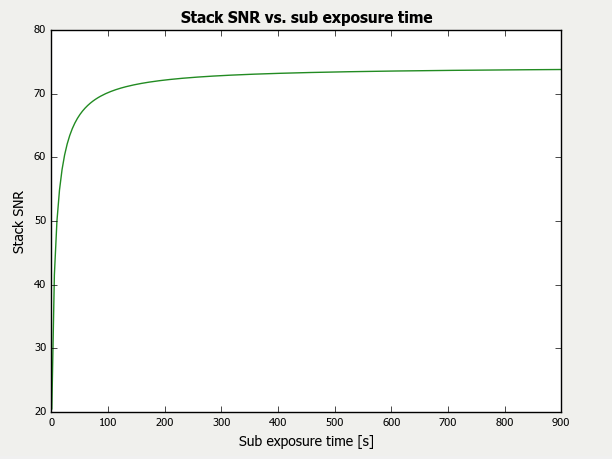
3. The program generates the data for a "Stack SNR vs. sub exposure time" plot, and finds the shortest exposure time for which the stack SNR would increase by less than 0.3% if you exposed for another 60 seconds. If this exposure time is shorter than the exposure time from step 3, it is chosen as the optimal sub exposure time.
4. Finally, the number of subframes required to get the total imaging time with this sub exposure time is calculated, and the optimal values together with some other relevant info is displayed.
10. The Plotting Tool
The Plotting Tool has essentially the same purpose as the Image Simulator, namely visualizing the effect of changing certain parameters, but it does so with graphs rather than an image. To plot a single graph, choose the graph you want from the list, input the required data (or transfer it from another tool), and click "Draw graph". You can also generate comparison plots. With these you just select an imaging parameter, and the graphs related to this parameter will be plotted together. This makes it easier to see how a given parameter affects various aspects of the image.
You can use the plots to find a lot of useful information. For a good example of this, take a look at Steve King's nice tutorial on determining the optimal exposure time using one of the plots. I plan to provide more information on interpreting the plots later on.
11. The Field of View Calculator
The Field of View Calculator lets you plan your imaging session by selecting targets and seeing how big they will appear in the image. Some information about the target, as well as the extent of your field of view, will also be displayed. The time, date and location can be set in the top left of the window. You can search for specific objects, or filter the list of targets by group (e.g. Messier objects or solar system object), type (e.g. spiral galaxy or globular cluster) and altitude. There is also a button for plotting the altitude of the target. This will bring up a graph showing the variation in altitude over time, as well as when and where the object rises, sets and culminates. You can also display the movement of the moon and the transitions between day and night.
12. Reliability of the results
The calculations of sensor data rely on accurate measurements of photon noise in a flat frame. The noise measurements can be affected if the flat frame is not uniform. To prevent this, the program asks for two flat frames, and subtracts one from the other to remove any features in the image.
If for some reason the two images are not equal (maybe a dust spot moved after the first frame was captured), then the subtracted image will not be uniform and the noise measurement will be affected. Keep this in mind when capturing the flat frames.
The results given by the Image Calculator are only as accurate as the data it uses for the calculations. While the data included in the default camera and telescope profiles shouldn't be too far off the correct values, I cannot vouch for its accuracy.
Most of the default DSLR data is not directly measured, but derived from other measurements performed by DxO for their DxOMark site. The CCD data is collected from various manufacturer sites and from other people posting their measurements. On top of this, I have had to make certain assumptions about the black and white levels, simply because there isn't enough data available.
For these reasons, I definitely recommend that you use the Image Analyser to perform your own measurements on your camera. Capturing the test frames is simple, and you hardly have to leave your chair.
When it comes to DSLRs, there is also the matter of raw frame "cooking". For many (if not all) models, additional processing is being done to the images before they are saved. For at least some Canon models, the images are darkened and the contrast is decreased for long exposure times (as described in this article by Craig Stark).
APLab does not try to compensate for this kind of in-camera processing, because of insufficient knowledge of what is being done to the images. But by using measurements of noise rather than intensity in certain circumstances, the calculations are less sensitive to effects like long exposure darkening.
13. Tools used
- Python 3
- Tcl/Tk
- NumPy
- matplotlib
- Python Imaging Library (PIL)
- PyFITS
- ExifRead
- dcraw
- PyEphem
- sidereal.py
- PyInstaller
14. Troubleshooting
If you encounter an issue with the program, here is the standard procedure:
- Did you get an error message in the program?
If yes:
The message has been stored in the file "errorlog.txt" in the "aplab_errorlog" subdirectory. Contact me, describe the issue and provide the error log.
If no:
On Windows, run the APLab_debug executable (located in the same folder as the APLab executable) and try to replicate the error. The debug version differ from the regular versions in a single aspect, namely that they run with the terminal visible in the background. On Linux, you can just run the APLab executable from the terminal. Any errors that are not caught by the logging function of the program might be displayed in the terminal.
- Did you get an error message in the terminal?
If yes:
Contact me, describe the issue and provide the error message.
If no:
Contact me about the issue anyway.